Metrics
Metrics creates custom metrics asynchronously by logging metrics to standard output following Amazon CloudWatch Embedded Metric Format (EMF).
These metrics can be visualized through Amazon CloudWatch Console.
Key features
- Aggregate up to 100 metrics using a single CloudWatch EMF object (large JSON blob)
- Validate against common metric definitions mistakes (metric unit, values, max dimensions, max metrics, etc)
- Metrics are created asynchronously by CloudWatch service, no custom stacks needed
- Context manager to create a one off metric with a different dimension
Terminologies
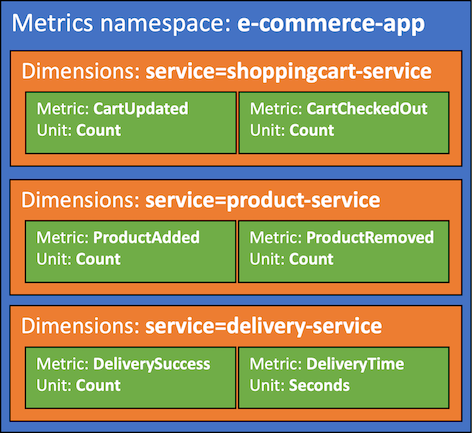
If you're new to Amazon CloudWatch, there are five terminologies you must be aware of before using this utility:
- Namespace. It's the highest level container that will group multiple metrics from multiple services for a given application, for example
ServerlessEcommerce. - Dimensions. Metrics metadata in key-value format. They help you slice and dice metrics visualization, for example
ColdStartmetric by Paymentservice. - Metric. It's the name of the metric, for example:
SuccessfulBookingorUpdatedBooking. - Unit. It's a value representing the unit of measure for the corresponding metric, for example:
CountorSeconds. - Resolution. It's a value representing the storage resolution for the corresponding metric. Metrics can be either Standard or High resolution. Read more here.
Getting started
Tip
All examples shared in this documentation are available within the project repository.
Metric has two global settings that will be used across all metrics emitted:
| Setting | Description | Environment variable | Constructor parameter |
|---|---|---|---|
| Metric namespace | Logical container where all metrics will be placed e.g. ServerlessAirline |
POWERTOOLS_METRICS_NAMESPACE |
namespace |
| Service | Optionally, sets service metric dimension across all metrics e.g. payment |
POWERTOOLS_SERVICE_NAME |
service |
Info
POWERTOOLS_METRICS_DISABLED will not disable default metrics created by AWS services.
Tip
Use your application or main service as the metric namespace to easily group all metrics.
| AWS Serverless Application Model (SAM) example | |
|---|---|
1 2 3 4 5 6 7 8 9 10 11 12 13 14 15 16 17 18 19 20 21 22 23 24 25 26 | |
Note
For brevity, all code snippets in this page will rely on environment variables above being set.
This ensures we instantiate metrics = Metrics() over metrics = Metrics(service="booking", namespace="ServerlessAirline"), etc.
Creating metrics
You can create metrics using add_metric, and you can create dimensions for all your aggregate metrics using add_dimension method.
Tip
You can initialize Metrics in any other module too. It'll keep track of your aggregate metrics in memory to optimize costs (one blob instead of multiples).
1 2 3 4 5 6 7 8 9 10 | |
1 2 3 4 5 6 7 8 9 10 11 12 13 14 | |
Tip: Autocomplete Metric Units
MetricUnit enum facilitate finding a supported metric unit by CloudWatch. Alternatively, you can pass the value as a string if you already know them e.g. unit="Count".
Note: Metrics overflow
CloudWatch EMF supports a max of 100 metrics per batch. Metrics utility will flush all metrics when adding the 100th metric. Subsequent metrics (101th+) will be aggregated into a new EMF object, for your convenience.
Warning: Do not create metrics or dimensions outside the handler
Metrics or dimensions added in the global scope will only be added during cold start. Disregard if that's the intended behavior.
Adding high-resolution metrics
You can create high-resolution metrics passing resolution parameter to add_metric.
When is it useful?
High-resolution metrics are data with a granularity of one second and are very useful in several situations such as telemetry, time series, real-time incident management, and others.
1 2 3 4 5 6 7 8 9 10 | |
Tip: Autocomplete Metric Resolutions
MetricResolution enum facilitates finding a supported metric resolution by CloudWatch. Alternatively, you can pass the values 1 or 60 (must be one of them) as an integer e.g. resolution=1.
Adding multi-value metrics
You can call add_metric() with the same metric name multiple times. The values will be grouped together in a list.
1 2 3 4 5 6 7 8 9 10 11 12 13 14 15 | |
1 2 3 4 5 6 7 8 9 10 11 12 13 14 15 16 17 18 19 20 21 22 23 24 25 26 27 28 | |
Adding default dimensions
You can use set_default_dimensions method, or default_dimensions parameter in log_metrics decorator, to persist dimensions across Lambda invocations.
If you'd like to remove them at some point, you can use clear_default_dimensions method.
1 2 3 4 5 6 7 8 9 10 11 12 13 14 15 | |
1 2 3 4 5 6 7 8 9 10 11 12 13 14 15 16 | |
Note: Dimensions with empty values will not be included.
Changing default timestamp
When creating metrics, we use the current timestamp. If you want to change the timestamp of all the metrics you create, utilize the set_timestamp function. You can specify a datetime object or an integer representing an epoch timestamp in milliseconds.
Note that when specifying the timestamp using an integer, it must adhere to the epoch timezone format in milliseconds.
Info
If you need to use different timestamps across multiple metrics, opt for single_metric.
1 2 3 4 5 6 7 8 9 10 11 12 13 14 15 | |
Flushing metrics
As you finish adding all your metrics, you need to serialize and flush them to standard output. You can do that automatically with the log_metrics decorator.
This decorator also validates, serializes, and flushes all your metrics. During metrics validation, if no metrics are provided then a warning will be logged, but no exception will be raised.
1 2 3 4 5 6 7 8 9 10 | |
1 2 3 4 5 6 7 8 9 10 11 12 13 14 15 16 17 18 19 20 21 22 23 24 25 | |
Tip: Metric validation
If metrics are provided, and any of the following criteria are not met, SchemaValidationError exception will be raised:
- Maximum of 29 user-defined dimensions
- Namespace is set, and no more than one
- Metric units must be supported by CloudWatch
Raising SchemaValidationError on empty metrics
If you want to ensure at least one metric is always emitted, you can pass raise_on_empty_metrics to the log_metrics decorator:
| Raising SchemaValidationError exception if no metrics are added | |
|---|---|
1 2 3 4 5 6 7 8 9 10 | |
Suppressing warning messages on empty metrics
If you expect your function to execute without publishing metrics every time, you can suppress the warning with warnings.filterwarnings("ignore", "No application metrics to publish*").
Capturing cold start metric
You can optionally capture cold start metrics with log_metrics decorator via capture_cold_start_metric param.
1 2 3 4 5 6 7 8 | |
1 2 3 4 5 6 7 8 9 10 11 12 13 14 15 16 17 18 19 20 21 22 23 24 25 26 27 | |
If it's a cold start invocation, this feature will:
- Create a separate EMF blob solely containing a metric named
ColdStart - Add
function_nameandservicedimensions
This has the advantage of keeping cold start metric separate from your application metrics, where you might have unrelated dimensions.
Info
We do not emit 0 as a value for ColdStart metric for cost reasons. Let us know if you'd prefer a flag to override it.
Customizing function name for cold start metrics
When emitting cold start metrics, the function_name dimension defaults to context.function_name. If you want to change the value you can set the function_name parameter in the metrics constructor, or define the environment variable POWERTOOLS_METRICS_FUNCTION_NAME.
The priority of the function_name dimension value is defined as:
function_nameconstructor optionPOWERTOOLS_METRICS_FUNCTION_NAMEenvironment variablecontext.function_nameproperty
1 2 3 4 5 6 7 8 | |
Environment variables
The following environment variable is available to configure Metrics at a global scope:
| Setting | Description | Environment variable | Default |
|---|---|---|---|
| Namespace Name | Sets namespace used for metrics. | POWERTOOLS_METRICS_NAMESPACE |
None |
| Service | Sets service metric dimension across all metrics e.g. payment |
POWERTOOLS_SERVICE_NAME |
None |
| Function Name | Function name used as dimension for the ColdStart metric. | POWERTOOLS_METRICS_FUNCTION_NAME |
None |
| Disable Powertools Metrics | Disables all metrics emitted by Powertools. | POWERTOOLS_METRICS_DISABLED |
None |
POWERTOOLS_METRICS_NAMESPACE is also available on a per-instance basis with the namespace parameter, which will consequently override the environment variable value.
Advanced
Adding metadata
You can add high-cardinality data as part of your Metrics log with add_metadata method. This is useful when you want to search highly contextual information along with your metrics in your logs.
Info
This will not be available during metrics visualization - Use dimensions for this purpose
1 2 3 4 5 6 7 8 9 10 11 12 13 | |
1 2 3 4 5 6 7 8 9 10 11 12 13 14 15 16 17 18 19 20 21 22 23 24 25 26 | |
Single metric
CloudWatch EMF uses the same dimensions and timestamp across all your metrics. Use single_metric if you have a metric that should have different dimensions or timestamp.
Working with different dimensions
Generally, using different dimensions would be an edge case since you pay for unique metric.
Keep the following formula in mind: unique metric = (metric_name + dimension_name + dimension_value)
1 2 3 4 5 6 7 8 9 10 11 12 | |
1 2 3 4 5 6 7 8 9 10 11 12 13 14 15 16 17 18 19 20 21 22 23 24 25 26 27 | |
By default it will skip all previously defined dimensions including default dimensions. Use default_dimensions keyword argument if you want to reuse default dimensions or specify custom dimensions from a dictionary.
1 2 3 4 5 6 7 8 9 10 11 12 13 14 15 16 17 18 19 20 | |
1 2 3 4 5 6 7 8 9 10 11 12 13 14 15 16 17 | |
Working with different timestamp
When working with multiple metrics, customers may need different timestamps between them. In such cases, utilize single_metric to flush individual metrics with specific timestamps.
1 2 3 4 5 6 7 8 9 10 11 12 13 14 15 16 | |
1 2 3 4 5 6 7 8 9 10 11 12 13 14 15 16 17 18 19 20 21 22 23 24 25 26 27 | |
Flushing metrics manually
If you are using the AWS Lambda Web Adapter project, or a middleware with custom metric logic, you can use flush_metrics(). This method will serialize, print metrics available to standard output, and clear in-memory metrics data.
Warning
This does not capture Cold Start metrics, and metric data validation still applies.
Contrary to the log_metrics decorator, you are now also responsible to flush metrics in the event of an exception.
| Manually flushing and clearing metrics from memory | |
|---|---|
1 2 3 4 5 6 7 8 9 10 11 12 13 14 15 16 17 18 | |
Metrics isolation
You can use EphemeralMetrics class when looking to isolate multiple instances of metrics with distinct namespaces and/or dimensions.
This is a typical use case is for multi-tenant, or emitting same metrics for distinct applications.
| EphemeralMetrics usage | |
|---|---|
1 2 3 4 5 6 7 8 9 | |
Differences between EphemeralMetrics and Metrics
EphemeralMetrics has only one difference while keeping nearly the exact same set of features:
| Feature | Metrics | EphemeralMetrics |
|---|---|---|
| Share data across instances (metrics, dimensions, metadata, etc.) | Yes | - |
Why not changing the default Metrics behaviour to not share data across instances?
This is an intentional design to prevent accidental data deduplication or data loss issues due to CloudWatch EMF metric dimension constraint.
In CloudWatch, there are two metric ingestion mechanisms: EMF (async) and PutMetricData API (sync).
The former creates metrics asynchronously via CloudWatch Logs, and the latter uses a synchronous and more flexible ingestion API.
Key concept
CloudWatch considers a metric unique by a combination of metric name, metric namespace, and zero or more metric dimensions.
With EMF, metric dimensions are shared with any metrics you define. With PutMetricData API, you can set a list defining one or more metrics with distinct dimensions.
This is a subtle yet important distinction. Imagine you had the following metrics to emit:
| Metric Name | Dimension | Intent |
|---|---|---|
| SuccessfulBooking | service="booking", tenant_id="sample" | Application metric |
| IntegrationLatency | service="booking", function_name="sample" | Operational metric |
| ColdStart | service="booking", function_name="sample" | Operational metric |
The tenant_id dimension could vary leading to two common issues:
ColdStartmetric will be created multiple times (N * number of unique tenant_id dimension value), despite thefunction_namebeing the sameIntegrationLatencymetric will be also created multiple times due totenant_idas well asfunction_name(may or not be intentional)
These issues are exacerbated when you create (A) metric dimensions conditionally, (B) multiple metrics' instances throughout your code instead of reusing them (globals). Subsequent metrics' instances will have (or lack) different metric dimensions resulting in different metrics and data points with the same name.
Intentional design to address these scenarios
On 1, when you enable capture_start_metric feature, we transparently create and flush an additional EMF JSON Blob that is independent from your application metrics. This prevents data pollution.
On 2, you can use EphemeralMetrics to create an additional EMF JSON Blob from your application metric (SuccessfulBooking). This ensures that IntegrationLatency operational metric data points aren't tied to any dynamic dimension values like tenant_id.
That is why Metrics shares data across instances by default, as that covers 80% of use cases and different personas using Powertools. This allows them to instantiate Metrics in multiple places throughout their code - be a separate file, a middleware, or an abstraction that sets default dimensions.
Observability providers
An observability provider is an AWS Lambda Partner offering a platform for logging, metrics, traces, etc.
We provide a thin-wrapper on top of the most requested observability providers. We strive to keep a similar UX as close as possible while keeping our value add features.
Missing your preferred provider? Please create a feature request.
Current providers:
| Provider | Notes |
|---|---|
| Datadog | Uses Datadog SDK and Datadog Lambda Extension by default |
Testing your code
Setting environment variables
Tip
Ignore this section, if:
- You are explicitly setting namespace/default dimension via
namespaceandserviceparameters - You're not instantiating
Metricsin the global namespace
For example, Metrics(namespace="ServerlessAirline", service="booking")
Make sure to set POWERTOOLS_METRICS_NAMESPACE and POWERTOOLS_SERVICE_NAME before running your tests to prevent failing on SchemaValidation exception. You can set it before you run tests or via pytest plugins like dotenv.
| Injecting dummy Metric Namespace before running tests | |
|---|---|
1 | |
Clearing metrics
Metrics keep metrics in memory across multiple instances. If you need to test this behavior, you can use the following Pytest fixture to ensure metrics are reset incl. cold start:
| Clearing metrics between tests | |
|---|---|
1 2 3 4 5 6 7 8 9 10 11 12 13 14 | |
Functional testing
You can read standard output and assert whether metrics have been flushed. Here's an example using pytest with capsys built-in fixture:
1 2 3 4 5 6 7 8 9 10 11 12 13 14 15 | |
1 2 3 4 5 6 7 8 9 10 | |
This will be needed when using capture_cold_start_metric=True, or when both Metrics and single_metric are used.
1 2 3 4 5 6 7 8 9 10 11 12 13 14 15 16 17 18 19 20 21 22 23 24 25 26 27 28 29 30 31 32 33 34 35 | |
1 2 3 4 5 6 7 8 9 10 | |
Tip
For more elaborate assertions and comparisons, check out our functional testing for Metrics utility.