Logger
Logger provides an opinionated logger with output structured as JSON.
Key features
- Capturing key fields from the Lambda context, cold starts, and structure logging output as JSON.
- Logging Lambda invocation events when instructed (disabled by default).
- Switch log level to
DEBUGfor a percentage of invocations (sampling). - Buffering logs for a specific request or invocation, and flushing them automatically on error or manually as needed.
- Appending additional keys to structured logs at any point in time.
- Providing a custom log formatter (Bring Your Own Formatter) to output logs in a structure compatible with your organization’s Logging RFC.
Getting started
Installation
Install the library in your project:
1 | |
Usage
The Logger utility must always be instantiated outside the Lambda handler. By doing this, subsequent invocations processed by the same instance of your function can reuse these resources. This saves cost by reducing function run time. In addition, Logger can keep track of a cold start and inject the appropriate fields into logs.
1 2 3 4 5 6 7 | |
Utility settings
The library has three optional settings, which can be set via environment variables or passed in the constructor.
These settings will be used across all logs emitted:
| Setting | Description | Environment variable | Default Value | Allowed Values | Example Value | Constructor parameter |
|---|---|---|---|---|---|---|
| Service name | Sets the name of service of which the Lambda function is part of, that will be present across all log statements | POWERTOOLS_SERVICE_NAME |
service_undefined |
Any string | serverlessAirline |
serviceName |
| Logging level | Sets how verbose Logger should be, from the most verbose to the least verbose (no logs) | POWERTOOLS_LOG_LEVEL |
INFO |
DEBUG, INFO, WARN, ERROR, CRITICAL, SILENT |
ERROR |
logLevel |
| Sample rate | Probability that a Lambda invocation will print all the log items regardless of the log level setting | POWERTOOLS_LOGGER_SAMPLE_RATE |
0 |
0.0 to 1.0 |
0.1 |
sampleRateValue |
Info
When POWERTOOLS_DEV environment variable is present and set to "true" or "1", Logger will pretty-print log messages for easier readability. We recommend to use this setting only when debugging on local environments.
See all environment variables in the Environment variables section. Check API docs to learn more about Logger constructor options.
Example using AWS Serverless Application Model (SAM)
1 2 3 4 5 6 7 8 9 10 11 | |
1 2 3 4 5 6 7 8 9 | |
Standard structured keys
Your Logger will include the following keys to your structured logging (default log formatter):
| Key | Example | Note |
|---|---|---|
level: string |
INFO |
Logging level set for the Lambda function's invocation |
message: string |
Query performed to DynamoDB |
A descriptive, human-readable representation of this log item |
sampling_rate: float |
0.1 |
When enabled, it prints all the logs of a percentage of invocations, e.g. 10% |
service: string |
serverlessAirline |
A unique name identifier of the service this Lambda function belongs to, by default service_undefined |
timestamp: string |
2011-10-05T14:48:00.000Z |
Timestamp string in simplified extended ISO format (ISO 8601) |
xray_trace_id: string |
1-5759e988-bd862e3fe1be46a994272793 |
X-Ray Trace ID. This value is always presented in Lambda environment, whether tracing is enabled or not. Logger will always log this value. |
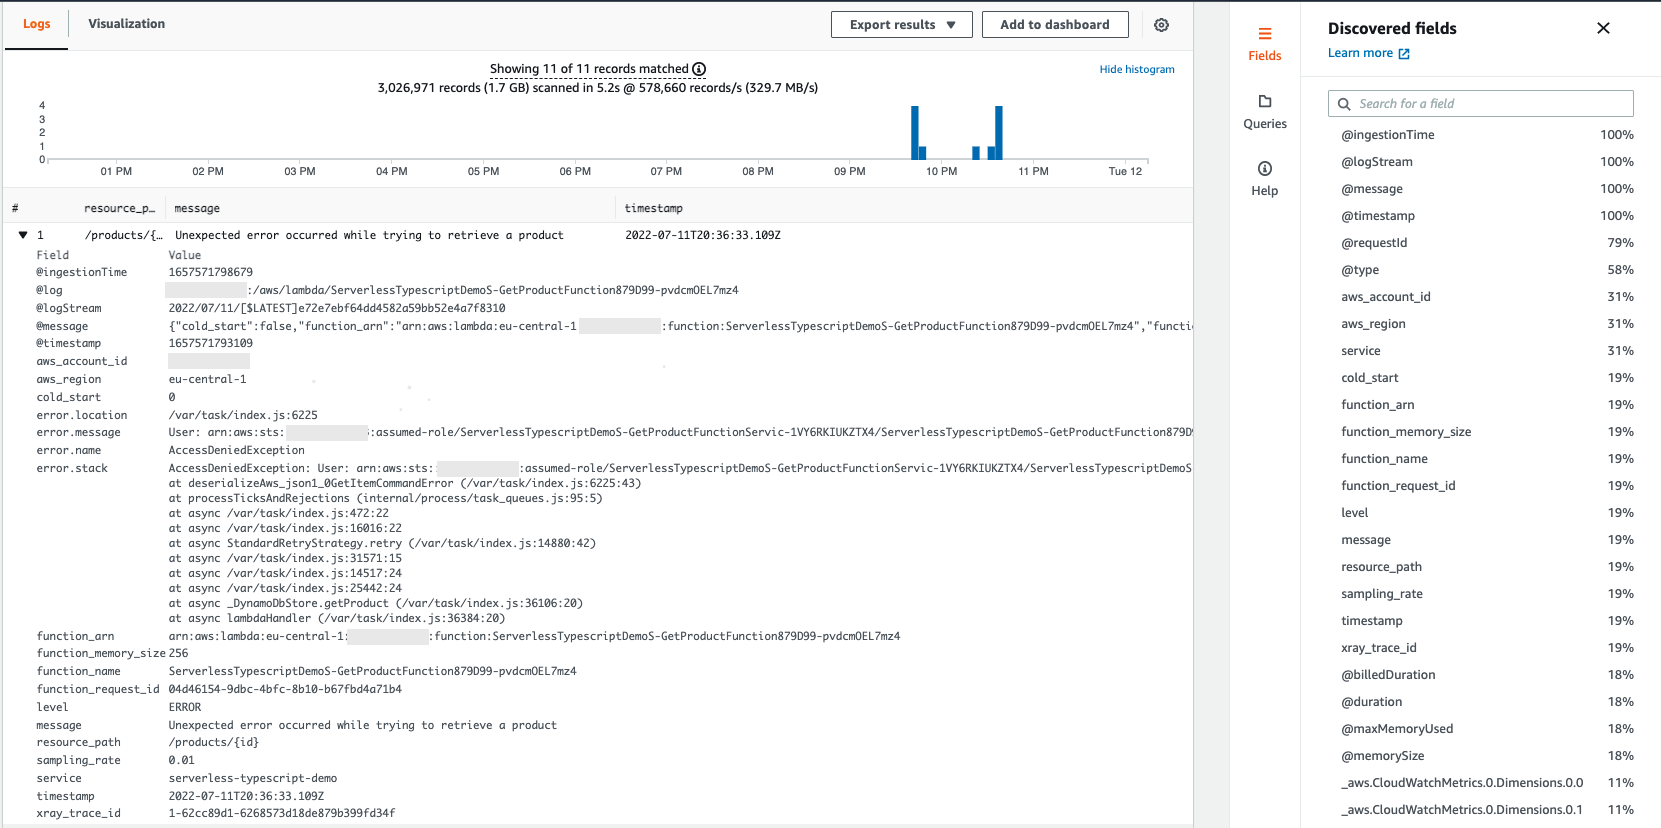
error: Object |
{ name: "Error", location: "/my-project/handler.ts:18", message: "Unexpected error #1", stack: "[stacktrace]"} |
Optional - An object containing information about the Error passed to the logger |
Note
If you emit a log message with a key that matches one of level, message, sampling_rate, service, or timestamp, the Logger will log a warning message and ignore the key.
Capturing Lambda context info
You can enrich your structured logs with key Lambda context information in multiple ways.
This functionality will include the following keys in your structured logs:
| Key | Example |
|---|---|
cold_start: bool |
false |
function_name string |
shopping-cart-api-lambda-prod-eu-west-1 |
function_memory_size: number |
128 |
function_arn: string |
arn:aws:lambda:eu-west-1:123456789012:function:shopping-cart-api-lambda-prod-eu-west-1 |
function_request_id: string |
c6af9ac6-7b61-11e6-9a41-93e812345678 |
A note about Middy
We guarantee support for Middy.js v4.x through v6.x versions.
Check their docs to learn more about Middy and its middleware stack as well as best practices when working with Powertools.
1 2 3 4 5 6 7 8 9 10 11 12 13 14 | |
Note
The class method decorators in this project follow the experimental implementation enabled via the experimentalDecorators compiler option in TypeScript.
Additionally, they are implemented to decorate async methods. When decorating a synchronous one, the decorator replaces its implementation with an async one causing the caller to have to await the now decorated method.
If this is not the desired behavior, you can call the logger.injectLambdaContext() method directly in your handler.
1 2 3 4 5 6 7 8 9 10 11 12 13 14 15 | |
- Binding your handler method allows your handler to access
thiswithin the class methods.
1 2 3 4 5 6 7 8 9 10 11 12 13 | |
In each case, the printed log will look like this:
1 2 3 4 5 6 7 8 9 10 11 12 | |
Log incoming event
When debugging in non-production environments, you can log the incoming event using the logEventIfEnabled() method or by setting the logEvent option in the injectLambdaContext() Middy.js middleware or class method decorator.
Warning
This is disabled by default to prevent sensitive info being logged
1 2 3 4 5 6 7 8 9 10 | |
- You can control the event logging via the
POWERTOOLS_LOGGER_LOG_EVENTenvironment variable.
1 2 3 4 5 6 7 8 9 10 11 | |
- The
logEventoption takes precedence over thePOWERTOOLS_LOGGER_LOG_EVENTenvironment variable.
1 2 3 4 5 6 7 8 9 10 11 12 13 14 | |
- The
logEventoption takes precedence over thePOWERTOOLS_LOGGER_LOG_EVENTenvironment variable.
1 2 3 | |
1 2 3 4 5 6 7 8 9 10 11 12 13 14 15 16 | |
Use POWERTOOLS_LOGGER_LOG_EVENT environment variable to enable or disable (true/false) this feature. When using Middy.js middleware or class method decorator, the logEvent option will take precedence over the environment variable.
Setting a Correlation ID
To get started, install the @aws-lambda-powertools/jmespath package, and pass the search function using the correlationIdSearchFn constructor parameter:
1 2 3 4 5 6 | |
Tip
You can retrieve correlation IDs via getCorrelationId method.
You can set a correlation ID using correlationIdPath parameter by passing a JMESPath expression, including our custom JMESPath functions or set it manually by calling setCorrelationId function.
1 2 3 4 5 6 7 8 9 10 | |
- Alternatively, if the payload is more complex you can use a JMESPath expression as second parameter when prividing a search function in the constructor.
1 2 3 4 5 6 7 8 9 10 11 12 13 14 15 16 17 18 | |
1 2 3 4 5 6 7 8 9 10 11 12 13 14 15 16 17 18 19 | |
1 2 3 4 5 | |
1 2 3 4 5 6 7 | |
To ease routine tasks like extracting correlation ID from popular event sources, we provide built-in JMESPath expressions.
1 2 3 4 5 6 7 8 9 10 11 12 13 14 15 16 17 18 19 20 21 22 | |
Note: Any object key named with - must be escaped
For example, request.headers."x-amzn-trace-id".
| Name | Expression | Description |
|---|---|---|
| API_GATEWAY_REST | 'requestContext.requestId' |
API Gateway REST API request ID |
| API_GATEWAY_HTTP | 'requestContext.requestId' |
API Gateway HTTP API request ID |
| APPSYNC_AUTHORIZER | 'requestContext.requestId' |
AppSync resolver request ID |
| APPSYNC_RESOLVER | 'request.headers."x-amzn-trace-id"' |
AppSync X-Ray Trace ID |
| APPLICATION_LOAD_BALANCER | 'headers."x-amzn-trace-id"' |
ALB X-Ray Trace ID |
| EVENT_BRIDGE | 'id' |
EventBridge Event ID |
| LAMBDA_FUNCTION_URL | 'requestContext.requestId' |
Lambda Function URL request ID |
| S3_OBJECT_LAMBDA | 'xAmzRequestId' |
S3 Object trigger request ID |
| VPC_LATTICE | 'headers."x-amzn-trace-id' |
VPC Lattice X-Ray Trace ID |
Appending additional keys
You can append additional keys using either mechanism:
- Add extra keys to a single log message by passing them to the log method directly
- Append temporary keys to all future log messages via the
appendKeys()method untilresetKeys()is called - Set Persistent keys for the logger instance via the
persistentKeysconstructor option or theappendPersistentKeys()method
To prevent you from accidentally overwriting some of the standard keys, we will log a warning message and ignore the key if you try to overwrite them.
Extra keys
You can append additional data to a single log item by passing objects as additional parameters.
- Pass a simple string for logging it with default key name
extra - Pass one or multiple objects containing arbitrary data to be logged. Each data object should be placed in an enclosing object as a single property value, you can name this property as you need:
{ myData: arbitraryObjectToLog } - If you already have an object containing a
messagekey and an additional property, you can pass this object directly
1 2 3 4 5 6 7 8 9 10 11 12 13 14 15 16 17 18 19 20 21 22 23 24 25 26 27 28 29 30 31 32 33 34 35 36 37 38 39 40 41 42 | |
1 2 3 4 5 6 7 8 9 10 11 12 13 14 15 16 17 18 19 20 21 22 23 24 25 26 27 28 29 30 31 32 33 34 35 36 37 38 | |
Temporary keys
You can append additional keys to all future log messages by using the appendKeys() method.
When is this useful?
This is helpful to contextualize log messages emitted during a specific function.
1 2 3 4 5 6 7 8 9 10 11 12 13 14 15 16 17 18 19 20 21 22 23 24 25 26 27 28 29 30 | |
- You can also remove specific keys by calling the
removeKeys()method.
1 2 3 4 5 6 7 8 9 10 11 12 13 14 15 | |
Persistent keys
You can persist keys across Lambda invocations by using the persistentKeys constructor option or the appendPersistentKeys() method. These keys will persist even if you call the resetKeys() method.
A common use case is to set keys about your environment or application version, so that you can easily filter logs in CloudWatch Logs.
1 2 3 4 5 6 7 8 9 10 11 12 13 14 15 16 17 18 | |
1 2 3 4 5 6 7 8 9 10 11 12 13 14 15 16 17 18 19 20 21 22 | |
1 2 3 4 5 6 7 8 9 | |
Removing additional keys
You can remove additional keys from the logger instance at any time:
- Remove temporary keys added via the
appendKeys()method by using theremoveKeys()method - Remove persistent keys added via the
persistentKeysconstructor option or theappendPersistentKeys()method by using theremovePersistentKeys()method
1 2 3 4 5 6 7 8 9 10 11 12 13 14 15 16 17 18 19 20 21 22 23 24 25 26 27 28 29 30 | |
1 2 3 4 5 6 7 8 9 10 11 12 13 14 15 16 17 18 19 20 21 22 23 24 | |
Resetting keys
Logger is commonly initialized in the global scope. Due to Lambda Execution Context reuse, this means that custom keys can be persisted across invocations.
Resetting the state allows you to clear all the temporary keys you have added.
Tip: When is this useful?
This is useful when you add multiple custom keys conditionally or when you use canonical or wide logs.
1 2 3 4 5 6 7 8 9 10 11 12 13 14 15 16 17 18 19 20 21 22 23 24 25 26 27 | |
1 2 3 4 5 6 7 8 9 10 11 12 13 14 15 16 17 18 19 20 21 22 23 24 | |
1 2 3 4 5 6 7 8 9 10 11 12 13 14 15 16 17 18 19 20 21 22 23 24 25 26 27 28 29 30 | |
- Binding your handler method allows your handler to access
thiswithin the class methods.
1 2 3 4 5 6 7 8 9 10 11 12 13 14 15 | |
1 2 3 4 5 6 7 8 9 10 11 12 13 14 | |
Logging errors
You can log errors by using the error method and pass the error object as parameter.
The error will be logged with default key name error, but you can also pass your own custom key name.
1 2 3 4 5 6 7 8 9 10 11 12 13 14 15 16 17 18 19 20 21 22 23 24 | |
1 2 3 4 5 6 7 8 9 10 11 12 13 14 15 16 17 18 19 20 21 22 23 24 25 26 | |
Logging errors and log level
You can also log errors using the warn, info, and debug methods. Be aware of the log level though, you might miss those errors when analyzing the log later depending on the log level configuration.
Advanced
Log levels
The default log level is INFO and can be set using the logLevel constructor option or by using the POWERTOOLS_LOG_LEVEL environment variable.
We support the following log levels:
| Level | Numeric value |
|---|---|
TRACE |
6 |
DEBUG |
8 |
INFO |
12 |
WARN |
16 |
ERROR |
20 |
CRITICAL |
24 |
SILENT |
28 |
You can access the current log level by using the getLevelName() method. This method returns the name of the current log level as a string. If you want to change the log level at runtime, you can use the setLogLevel() method. This method accepts a string value that represents the log level you want to set, both lower and upper case values are supported.
1 2 3 4 5 6 | |
If you want to access the numeric value of the current log level, you can use the level property. For example, if the current log level is INFO, logger.level property will return 12.
Silencing logs
The SILENT log level provides a simple and efficient way to suppress all log messages without the need to modify your code. When you set this log level, all log messages, regardless of their severity, will be silenced.
This feature is useful when you want to have your code instrumented to produce logs, but due to some requirement or business decision, you prefer to not emit them.
By setting the log level to SILENT, which can be done either through the logLevel constructor option or by using the POWERTOOLS_LOG_LEVEL environment variable, you can easily suppress all logs as needed.
Note
Use the SILENT log level with care, as it can make it more challenging to monitor and debug your application. Therefore, we advise using this log level judiciously.
AWS Lambda Advanced Logging Controls (ALC)
With AWS Lambda Advanced Logging Controls (ALC), you can control the output format of your logs as either TEXT or JSON and specify the minimum accepted log level for your application.
Regardless of the output format setting in Lambda, we will always output JSON formatted logging messages.
When you have this feature enabled, log messages that don’t meet the configured log level are discarded by Lambda. For example, if you set the minimum log level to WARN, you will only receive WARN and ERROR messages in your AWS CloudWatch Logs, all other log levels will be discarded by Lambda.
sequenceDiagram
    title Lambda ALC allows WARN logs only
    participant Lambda service
    participant Lambda function
    participant Application Logger

    Note over Lambda service: AWS_LAMBDA_LOG_LEVEL="WARN"
    Lambda service->>Lambda function: Invoke (event)
    Lambda function->>Lambda function: Calls handler
    Lambda function->>Application Logger: logger.warn("Something happened")
    Lambda function-->>Application Logger: logger.debug("Something happened")
    Lambda function-->>Application Logger: logger.info("Something happened")

    Lambda service->>Lambda service: DROP INFO and DEBUG logs

    Lambda service->>CloudWatch Logs: Ingest error logs
Priority of log level settings in Powertools for AWS Lambda
When the Advanced Logging Controls feature is enabled, we are unable to increase the minimum log level below the AWS_LAMBDA_LOG_LEVEL environment variable value, see AWS Lambda service documentation for more details.
We prioritise log level settings in this order:
AWS_LAMBDA_LOG_LEVELenvironment variable- Setting the log level in code using the
logLevelconstructor option, or by calling thelogger.setLogLevel()method POWERTOOLS_LOG_LEVELenvironment variable
In the event you have set a log level in Powertools to a level that is lower than the ACL setting, we will output a warning log message informing you that your messages will be discarded by Lambda.
Buffering logs
Log buffering enables you to buffer logs for a specific request or invocation. Enable log buffering by passing logBufferOptions when initializing a Logger instance. You can buffer logs at the WARNING, INFO, DEBUG, or TRACE level, and flush them automatically on error or manually as needed.
This is useful when you want to reduce the number of log messages emitted while still having detailed logs when needed, such as when troubleshooting issues.
1 2 3 4 5 6 7 8 9 10 11 12 13 14 15 16 17 18 19 20 | |
Configuring the buffer
When configuring the buffer, you can set the following options to fine-tune how logs are captured, stored, and emitted. You can configure the following options in the logBufferOptions constructor parameter:
| Parameter | Description | Configuration | Default |
|---|---|---|---|
enabled |
Enable or disable log buffering | true, false |
false |
maxBytes |
Maximum size of the log buffer in bytes | number |
20480 |
bufferAtVerbosity |
Minimum log level to buffer | TRACE, DEBUG, INFO, WARNING |
DEBUG |
flushOnErrorLog |
Automatically flush buffer when logging an error | true, false |
true |
1 2 3 4 5 6 7 8 9 10 11 12 13 14 15 16 | |
- Setting
bufferAtVerbosity: 'warn'configures log buffering forWARNINGand all lower severity levels likeINFO,DEBUG, andTRACE. - Calling
logger.clearBuffer()will clear the buffer without emitting the logs.
1 2 3 4 5 6 7 8 9 10 11 12 13 14 15 16 17 18 19 20 21 22 23 24 25 26 27 | |
- Disabling
flushOnErrorLogwill not flush the buffer when logging an error. This is useful when you want to control when the buffer is flushed by calling thelogger.flushBuffer()method.
Flushing on errors
When using the logger.injectLambdaContext() class method decorator or the injectLambdaContext() middleware, you can configure the logger to automatically flush the buffer when an error occurs. This is done by setting the flushBufferOnUncaughtError option to true in the decorator or middleware options.
1 2 3 4 5 6 7 8 9 10 11 12 13 14 15 16 17 18 19 20 21 22 23 | |
1 2 3 4 5 6 7 8 9 10 11 12 13 14 15 16 17 18 | |
Buffering workflows
Manual flush
sequenceDiagram
    participant Client
    participant Lambda
    participant Logger
    participant CloudWatch
    Client->>Lambda: Invoke Lambda
    Lambda->>Logger: Initialize with DEBUG level buffering
    Logger-->>Lambda: Logger buffer ready
    Lambda->>Logger: logger.debug("First debug log")
    Logger-->>Logger: Buffer first debug log
    Lambda->>Logger: logger.info("Info log")
    Logger->>CloudWatch: Directly log info message
    Lambda->>Logger: logger.debug("Second debug log")
    Logger-->>Logger: Buffer second debug log
    Lambda->>Logger: logger.flush_buffer()
    Logger->>CloudWatch: Emit buffered logs to stdout
    Lambda->>Client: Return execution result
Flushing when logging an error
sequenceDiagram
    participant Client
    participant Lambda
    participant Logger
    participant CloudWatch
    Client->>Lambda: Invoke Lambda
    Lambda->>Logger: Initialize with DEBUG level buffering
    Logger-->>Lambda: Logger buffer ready
    Lambda->>Logger: logger.debug("First log")
    Logger-->>Logger: Buffer first debug log
    Lambda->>Logger: logger.debug("Second log")
    Logger-->>Logger: Buffer second debug log
    Lambda->>Logger: logger.debug("Third log")
    Logger-->>Logger: Buffer third debug log
    Lambda->>Lambda: Exception occurs
    Lambda->>Logger: logger.error("Error details")
    Logger->>CloudWatch: Emit buffered debug logs
    Logger->>CloudWatch: Emit error log
    Lambda->>Client: Raise exception
Flushing on error
This works only when using the logger.injectLambdaContext() class method decorator or the injectLambdaContext() middleware. You can configure the logger to automatically flush the buffer when an error occurs by setting the flushBufferOnUncaughtError option to true in the decorator or middleware options.
sequenceDiagram
    participant Client
    participant Lambda
    participant Logger
    participant CloudWatch
    Client->>Lambda: Invoke Lambda
    Lambda->>Logger: Using decorator
    Logger-->>Lambda: Logger context injected
    Lambda->>Logger: logger.debug("First log")
    Logger-->>Logger: Buffer first debug log
    Lambda->>Logger: logger.debug("Second log")
    Logger-->>Logger: Buffer second debug log
    Lambda->>Lambda: Uncaught Exception
    Lambda->>CloudWatch: Automatically emit buffered debug logs
Lambda->>Client: Raise uncaught exceptionBuffering FAQs
-
Does the buffer persist across Lambda invocations? No, each Lambda invocation has its own buffer. The buffer is initialized when the Lambda function is invoked and is cleared after the function execution completes or when flushed manually.
-
Are my logs buffered during cold starts? No, we never buffer logs during cold starts. This is because we want to ensure that logs emitted during this phase are always available for debugging and monitoring purposes. The buffer is only used during the execution of the Lambda function.
-
How can I prevent log buffering from consuming excessive memory? You can limit the size of the buffer by setting the
maxBytesoption in thelogBufferOptionsconstructor parameter. This will ensure that the buffer does not grow indefinitely and consume excessive memory. -
What happens if the log buffer reaches its maximum size? Older logs are removed from the buffer to make room for new logs. This means that if the buffer is full, you may lose some logs if they are not flushed before the buffer reaches its maximum size. When this happens, we emit a warning when flushing the buffer to indicate that some logs have been dropped.
-
How is the log size of a log line calculated? The log size is calculated based on the size of the stringified log line in bytes. This includes the size of the log message, the size of any additional keys, and the size of the timestamp.
-
What timestamp is used when I flush the logs? The timestamp preserves the original time when the log record was created. If you create a log record at 11:00:10 and flush it at 11:00:25, the log line will retain its original timestamp of 11:00:10.
-
What happens if I try to add a log line that is bigger than max buffer size? The log will be emitted directly to standard output and not buffered. When this happens, we emit a warning to indicate that the log line was too big to be buffered.
-
What happens if Lambda times out without flushing the buffer? Logs that are still in the buffer will be lost. If you are using the log buffer to log asynchronously, you should ensure that the buffer is flushed before the Lambda function times out. You can do this by calling the
logger.flushBuffer()method at the end of your Lambda function. -
Do child loggers inherit the buffer? No, child loggers do not inherit the buffer from their parent logger but only the buffer configuration. This means that if you create a child logger, it will have its own buffer and will not share the buffer with the parent logger.
Reordering log keys position
You can change the order of standard Logger keys or any keys that will be appended later at runtime via the logRecordOrder parameter.
Note
This feature is available only in the default log formatter and not with custom log formatters.
1 2 3 4 5 6 7 8 9 10 11 12 | |
1 2 3 4 5 6 7 8 9 | |
Setting timestamp to custom timezone
By default, Logger emits records with the default Lambda timestamp in UTC, i.e. 2016-06-20T12:08:10.000Z
If you prefer to log in a specific timezone, you can configure it by setting the TZ environment variable. You can do this either as an environment variable or directly within your Lambda function settings.
Click here for a comprehensive list of available Lambda environment variables.
1 2 3 4 5 6 7 8 9 10 11 12 13 | |
1 2 3 4 5 6 7 8 9 10 11 12 13 14 15 16 17 18 | |
Creating child loggers
The createChild method allows you to create a child instance of the Logger, which inherits all of the attributes from its parent. You have the option to override any of the settings and attributes from the parent logger, including its settings, any extra keys, and the log formatter.
Once a child logger is created, the logger and its parent will act as separate instances of the Logger class, and as such any change to one won't be applied to the other.
The following example shows how to create multiple Loggers that share service name and persistent attributes while specifying different logging levels within a single Lambda invocation. As the result, only ERROR logs with all the inherited attributes will be displayed in CloudWatch Logs from the child logger, but all logs emitted will have the same service name and persistent attributes.
1 2 3 4 5 6 7 8 9 10 11 12 13 14 15 16 17 18 19 20 21 22 23 24 25 26 27 28 29 | |
1 2 3 4 5 6 7 8 9 10 11 12 13 14 15 16 17 18 19 20 21 22 23 24 25 26 27 | |
Sampling debug logs
Use sampling when you want to dynamically change your log level to DEBUG based on a percentage of your invocations.
You can use values ranging from 0 to 1 (100%) when setting the sampleRateValue constructor option or POWERTOOLS_LOGGER_SAMPLE_RATE env var.
When is this useful?
Let's imagine a sudden spike increase in concurrency triggered a transient issue downstream. When looking into the logs you might not have enough information, and while you can adjust log levels it might not happen again.
This feature takes into account transient issues where additional debugging information can be useful.
Sampling decision happens at the Logger initialization. When using the injectLambdaContext method either as a decorator or Middy.js middleware, the sampling decision is refreshed at the beginning of each Lambda invocation for you, except for cold starts.
If you're not using either of these, you'll need to manually call the refreshSamplingRate() function at the start of your handler to refresh the sampling decision for each invocation.
1 2 3 4 5 6 7 8 9 10 11 12 13 14 15 16 | |
- The log level must be set to a more verbose level than
DEBUGfor log sampling to kick in. - You need to call
logger.refreshSamplingRate()at the start of your handler only if you're not using theinjectLambdaContext()class method decorator or Middy.js middleware.
1 2 3 4 5 6 7 8 | |
1 2 3 4 5 6 7 8 9 10 11 12 13 14 15 16 17 18 19 20 21 22 23 24 25 26 27 28 29 30 31 32 33 34 | |
1 2 3 4 5 6 7 8 9 10 11 12 13 14 15 16 17 18 19 20 21 22 23 24 25 26 27 28 29 30 31 32 33 34 | |
1 2 3 4 5 6 7 8 | |
Custom Log formatter
You can customize the structure (keys and values) of your logs by passing a custom log formatter, a class that implements the LogFormatter interface, to the Logger constructor.
When working with custom log formatters, you take full control over the structure of your logs. This allows you to optionally drop or transform keys, add new ones, or change the format to suit your company's logging standards or use Logger with a third-party logging service.
1 2 3 4 5 6 7 8 9 10 11 12 13 14 15 16 17 18 19 20 21 22 23 24 25 26 27 28 | |
1 2 3 4 5 6 7 8 9 10 11 12 13 14 15 16 17 18 19 20 21 22 23 24 25 26 27 28 29 30 31 32 33 34 35 36 37 38 39 40 41 42 43 44 45 | |
1 2 3 4 5 6 7 8 9 10 11 12 13 14 15 16 17 18 19 20 21 22 23 24 25 | |
Note that when implementing this method, you should avoid mutating the attributes and additionalLogAttributes objects directly. Instead, create a new object with the desired structure and return it. If mutation is necessary, you can create a structuredClone of the object to avoid side effects.
Extend JSON replacer function
You can extend the default JSON serializer by passing a custom serializer function to the Logger constructor, using the jsonReplacerFn option. This is useful when you want to customize the serialization of specific values.
1 2 3 4 5 6 7 8 9 10 11 12 13 | |
1 2 3 4 5 6 7 8 9 10 11 12 13 | |
By default, Logger uses JSON.stringify() to serialize log items and a custom replacer function to serialize common unserializable values such as BigInt, circular references, and Error objects.
When you extend the default JSON serializer, we will call your custom serializer function before the default one. This allows you to customize the serialization while still benefiting from the default behavior.
Testing your code
Inject Lambda Context
When unit testing your code that makes use of logger.addContext() or injectLambdaContext middleware and decorator, you can optionally pass a dummy Lambda Context if you want your logs to contain this information.
This is a sample that provides the minimum information necessary for Logger to inject context data:
1 2 3 4 5 6 7 8 9 10 11 12 13 14 15 16 17 18 19 20 21 22 23 24 25 26 27 28 29 30 31 32 | |
Suppress logs
When unit testing your code with Jest or Vitest you can use the POWERTOOLS_DEV environment variable in conjunction with the --silent CLI option to suppress logs from Logger.
| Disabling logs while testing with Vitest | |
|---|---|
1 | |
Alternatively, you can also set the POWERTOOLS_DEV environment variable to true in your test setup file, or in a hoisted block at the top of your test file.